
It is an error that every developer is more than used to seeing; the application failed because a SQL database permission was missing. It is also a simple error to fix; just grant the permission (after following your firms strict audit processes, obviously!). The problem is knowing that it happened; if the application is ‘out there with the users’ you might not have a useful error message displayed, or the true error may lay several layers deep in your application stack. There is a quick and dirty solution to your problem!
Detecting SQL Permission Errors with SQL Server Profiler
SQL Server Profiler is a tool often installed along with SQL Server Management Studio (SSMS), or you can find it on the SQL Server itself. It allows you to ‘watch’ the queries that are occurring on your SQL Server; by default, it shows all traffic (queries, connections, errors, etc) and can be very noisy. You can, however, place filters on its datasets to only obtain information important to you; such as error 229 “Permission Denied”.
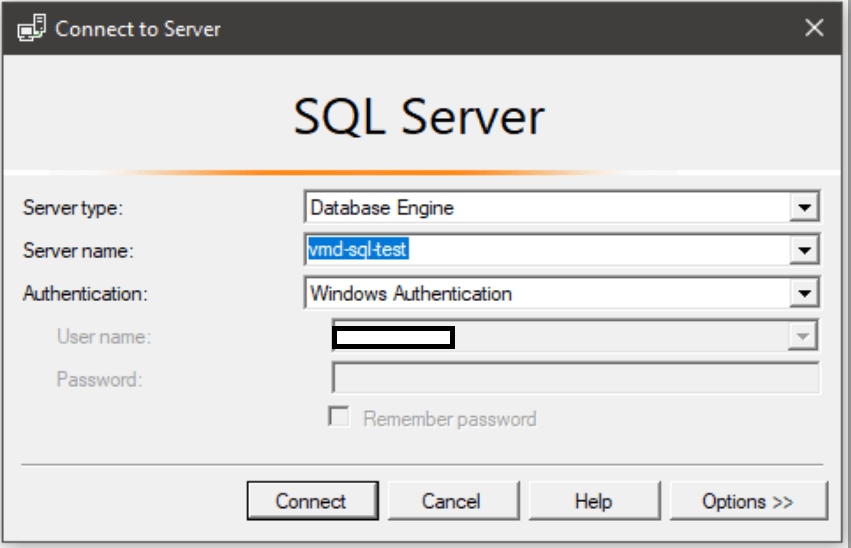
- Start SQL Profiler and connect to your SQL Database server, this will not actually start a trace so don’t be worried about affecting performance yet!
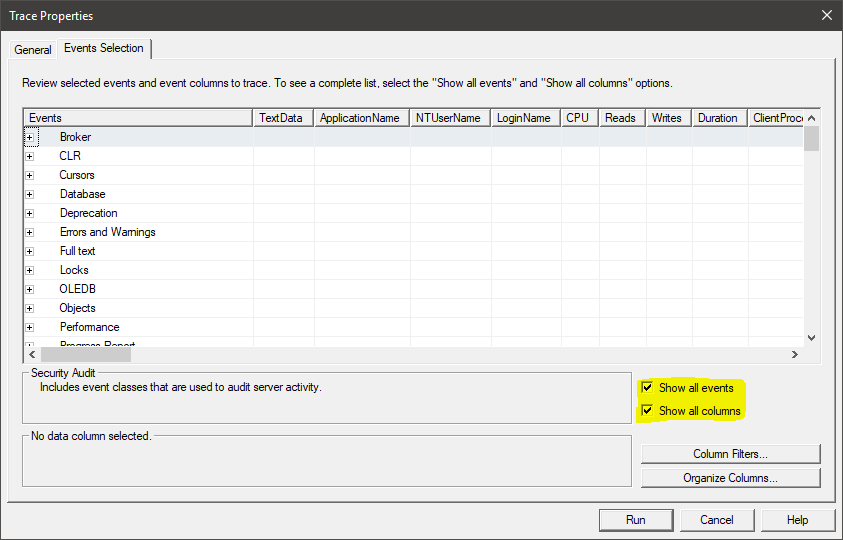
- When the ‘trace properties’ window opens, switch to the ‘Events Selection’ tab and tick the “show all events” and “show all columns” boxes. This will allow us to filter our results to the error we care about in the next step.
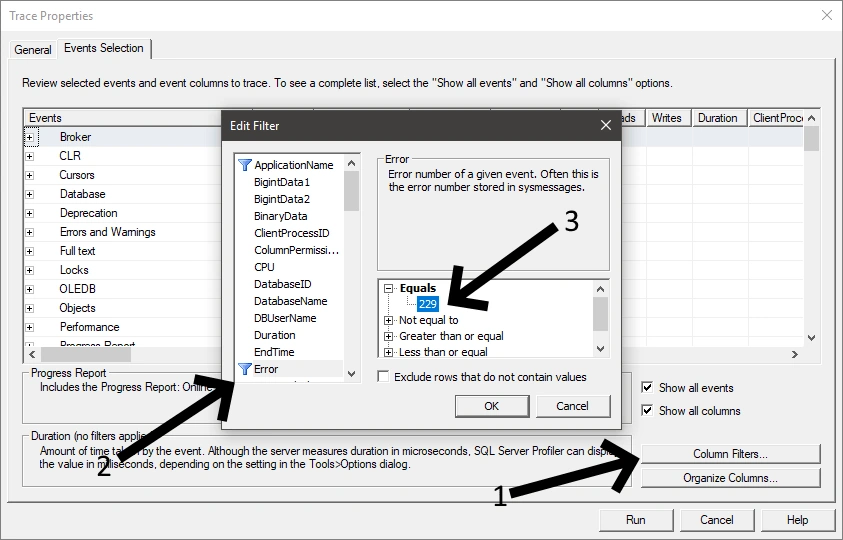
- Click the ‘Column Filters’ button and scroll down to the ‘Error’ type and enter ‘229’ into the equals filter.
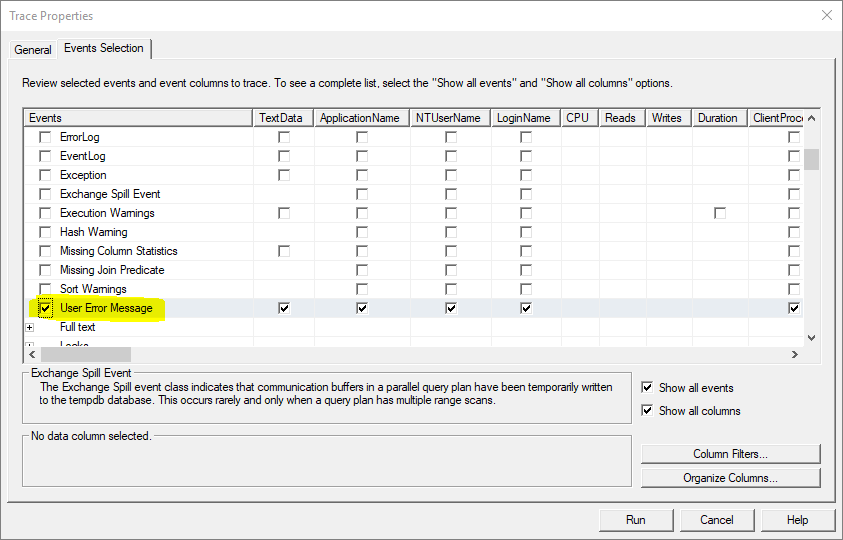
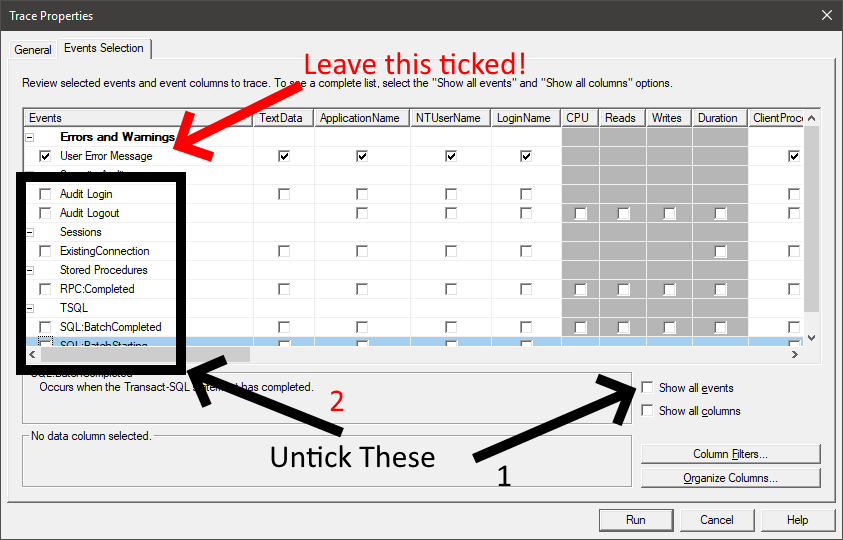
- Now scroll down the big list of events until you find “Errors and Warnings” section, expand it and find (and tick) the ‘User Error Message’ box.
- Now that you have filtered the results down to the error message in question; you will want to remove all the default information the trace provides, if only to clean up the results! Untick the two boxes we ticked in step 2 (the show all boxes); and then untick all the other checkboxes in the events selection.
- Now click RUN and sit back and wait for your permissions errors to occur!
Bonus Points
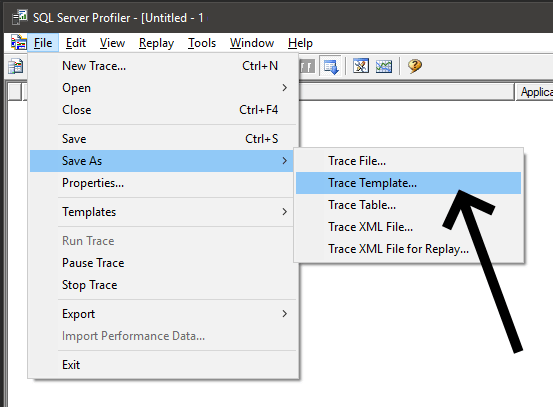
Rather than following the above six steps each time (as much as I am sure you want to revisit this blog post!); you can save your trace as a template for the future. Once your trace is running you can save it as a template for future use; from the file menu pick ‘Save As > Trace Tempalte’.
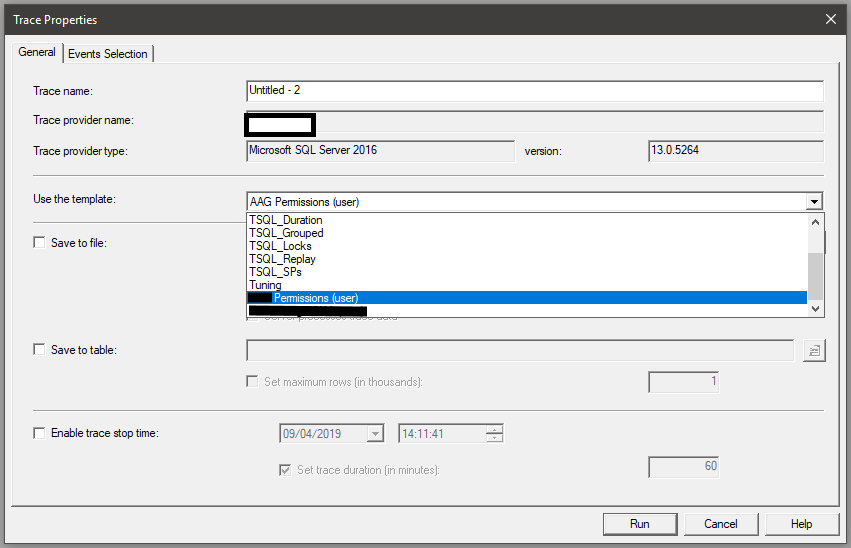
You can then pick your template from the ‘new trace’ window next time you need it.
Something Important!
SQL Server Traces are very powerful, so naturally they also use up a lot of resources. If you need to run a trace for a prolonged period of time it is sensible to run it directly on the SQL Server (remove the network from the equasion), and filter it as tightly as possible so that the server does not need to return too much information.
You can read more about SQL Traces in the MSDN Documentation.
Disclaimer
As always, please make sure you understand what you are doing, I take no responsiblity for your SQL Servers!
Do not run code you find on the internet on your production systems without testing it somewhere else first. Do not use this code if your vision becomes blurred. If the code runs for more than four hours seek medical attention imediatly. This code has been known (in rare circumstances) to cause one or more of the following: nausea, headaches, high blood preassure, cravings for old-school sweets, and the impluse to reformat tabs into spaces. If this code causes your servers to smoke, seek shelter. Never taunt this code.
Thank you to Kyle Glenn on Unsplash for the header image on this post.
Comments